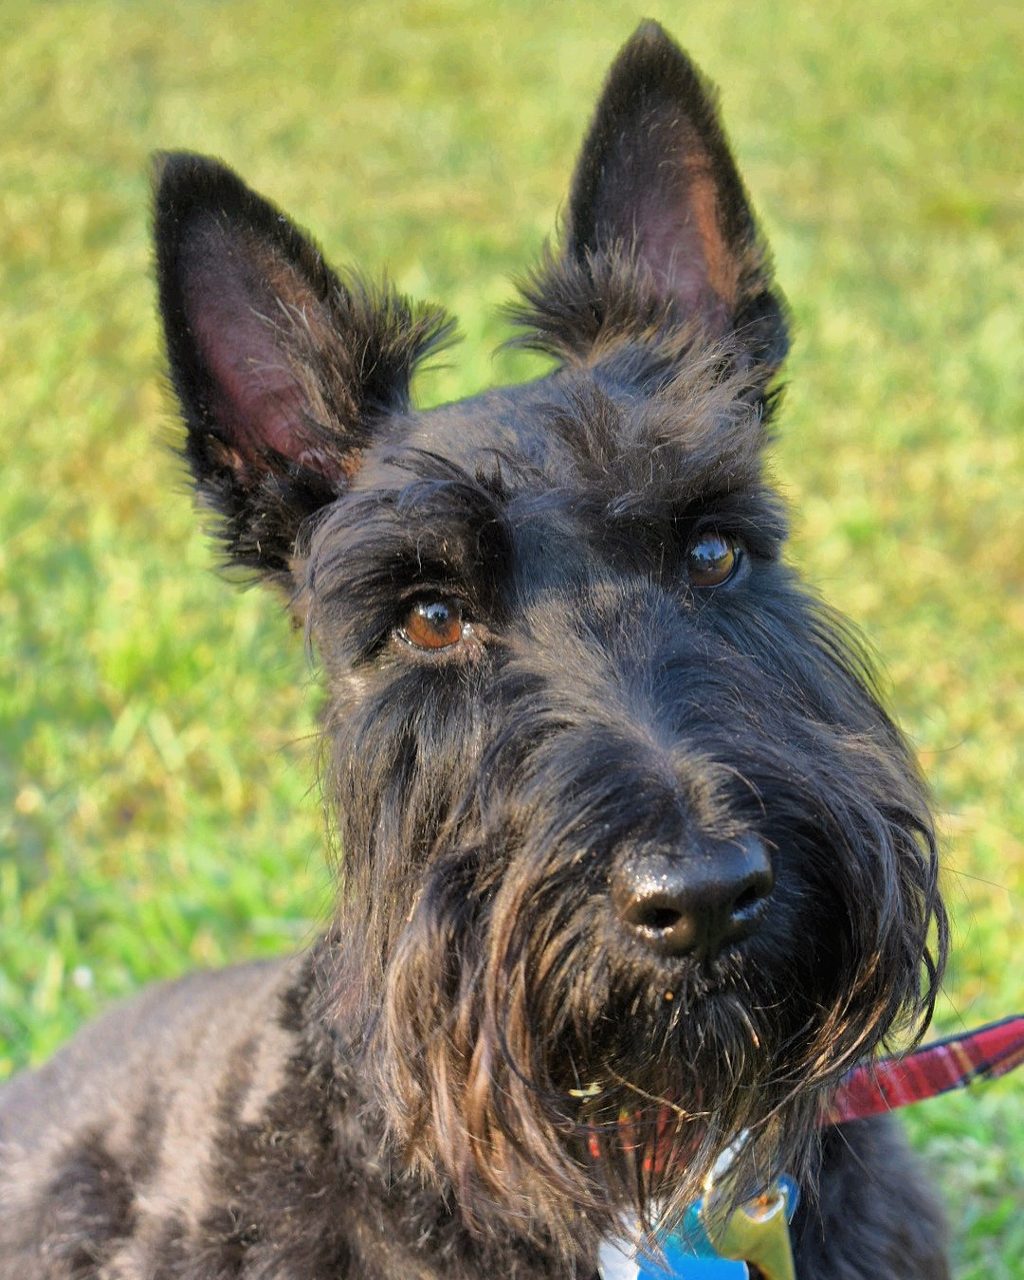
Scottish Terrier
33 Scottish Terriers in the atlas. Every number on this page has a source.
33 Scottish Terriers in the Sniff Atlas. Population-genetic snapshot, Mendelian carrier frequencies from Donner 2023, and the data substrate's release version, sample sizes, and evidence tier on every claim.
Also known as Aberdeenie and Scottie.
Scottish Terriers have a moderately varied genetic background. They’re a small, sturdy dog, usually weighing about 20 pounds and living around 12 to 13 years. One health note is that their gene pool includes a condition called Craniomandibular Osteopathy, so it’s a good idea to talk with your vet or consider genetic testing to keep your dog happy and healthy.
In the atlas, the Scottish Terrier clusters consistently as Scottish Terrier (100% of the 33 dogs here). At the trait loci, HMGA2 runs lower than average (3% here vs 56%); ADAMTS17 runs higher than the atlas average (100% here vs 54%). Dogs here sit in a relatively sparse region of the atlas, fewer close neighbors than typical.
Ranks 26 of 107 on the bottleneck severity scale, well into the upper quartile of population contraction.
What the genome says about Scottish Terrier
Computed from the 18,477 research dogs in the Atlas.
What does genetic diversity mean?
How varied a breed's gene pool is — the share of gene spots where a typical dog of the breed carries two different versions rather than two identical ones.
How to read it: Higher = more diverse. Among well-sampled breeds it ranges roughly 0.22 (least diverse) to 0.33 (most diverse).
Diversity is a strength, not a verdict on any individual dog. Lower diversity means it's worth paying attention to recessive-risk testing — not that a dog is doomed.
What does within-breed variation mean?
How much individual dogs within the breed differ from each other genetically.
How to read it: Higher = more internal variety among individuals of the breed.
Sensitive to how many dogs of the breed we've sampled.
What does typical lifespan mean?
The median age dogs of the breed tend to reach.
How to read it: Higher = longer-lived. Compare to longevity-for-size to see whether it's just a size effect.
Drawn from population lifespan records; individual dogs vary widely with care, genetics, and luck.
Frequency of the alternate allele in this breed at each locus's representative SNP.
| IGF1 | 78% |
| HMGA2 | 3% |
| SMAD2 | 83% |
| LCORL | 100% |
| STC2 | 98% |
| ADAMTS17 | 100% |
| FGF4·CFA18 | 53% |
| FGF4·CFA12 | 82% |
| RSPO2 | 100% |
| FGF5 | 58% |
| KRT71 | 88% |
| MC1R | 56% |
| MSRB3 | 96% |
| BMP3 | 55% |
| SMOC2 | 100% |
Other names
The Scottish Terrier is also recorded as Aberdeenie and Scottie.
Identified as Scottish Terrier (VBO:0201198) in the Vertebrate Breed Ontology (Mullen et al. 2025, CC-BY 4.0) · registry IDs FCI 73 · iDog 214 · VeNom 15049.
What does the genome say about how a Scottish Terrier looks?
Scottish Terriers look the way they do because of a small set of fixed and near-fixed morphology genes that, taken together, define the visible breed. Each translation below pairs the gene with the trait an owner actually sees, the breed's allele frequency at that locus, and a one-clause causal phrase.
Where the breed-defining genes act, mapped on a generic dog-body key — and how fixed each marker is in the Scottish Terrier. The figure is the most-settled marker we read in that region; the full per-locus panel is below. (The silhouette is a shared anatomical guide, not this breed's outline.)
Size and build
IGF1 sits at 78% for the small-body allele. IGF1 is the gene that sets dog body size from Chihuahua to Great Dane. Intermediate frequencies typically keep a breed in the mid-sized range rather than tipping toward the larger working forms.
IGF1what this gene does
IGF1 is a gene that plays a key role in determining a dog's body size. It influences how much a dog grows, affecting overall stature.
For your dog: Knowing about IGF1 gives you insight into your dog's size traits, but it’s just one part of the bigger picture when it comes to their health and care.
Full IGF1 gene page →HMGA2 is at 3%, leaving most of the size signal to other loci in the panel.
HMGA2what this gene does
HMGA2 is a gene that influences body size in dogs, helping determine how big or small a dog grows.
For your dog: Knowing about HMGA2 helps you appreciate the genetic factors behind your dog's size, but it doesn't signal any health issues.
Full HMGA2 gene page →SMAD2 sits at 83% at the chromosome-7 height locus.
SMAD2what this gene does
SMAD2 is a gene involved in regulating body size by influencing how cells grow and develop.
For your dog: Knowing about SMAD2 helps understand your dog's size traits but isn't linked to health issues; no immediate action needed.
Full SMAD2 gene page →LCORL is near-fixed at 100%, the NCAPG/LCORL height locus that is one of the strongest single contributors to canine body size.
LCORLwhat this gene does
LCORL is a gene that influences body size in dogs. It helps determine how big or small a dog might grow.
For your dog: Knowing about LCORL helps you appreciate the genetic factors behind your dog's size, but it’s just one piece of the bigger picture when it comes to health and care.
Full LCORL gene page →STC2 is near-fixed at 98%, modulating growth-axis signaling toward the breed's body-size set point.
ADAMTS17 is at 100%, near-fixed for the size variant.
ADAMTS17what this gene does
ADAMTS17 is a gene that influences body size and also plays a role in certain eye conditions. It affects the structure of tissues in the eye and elsewhere in the body.
For your dog: If your dog belongs to a breed known to carry ADAMTS17 variants, it’s worth discussing genetic testing and eye exams with your vet to stay ahead of potential issues.
Full ADAMTS17 gene page →Leg length
The FGF4 retrogene on chromosome 18 sits at 53%. This is the leg-length variant. The intermediate frequency means some dogs in this breed carry the short-legged allele and some do not.
The FGF4 retrogene on chromosome 12 sits at 82%, the chondrodystrophic variant.
Coat type, length, and color
RSPO2 is near-fixed at 100% for the furnishings allele, the genetic basis of the eyebrows-and-mustache pattern seen in Schnauzers and Wheaten Terriers.
RSPO2what this gene does
RSPO2 influences the texture and appearance of a dog's coat, particularly the presence of 'furnishings' like mustaches and eyebrows. It helps determine whether a dog has that distinctive wiry or textured look.
For your dog: If your dog has those wiry eyebrows or a mustache, RSPO2 is part of the reason—no health worries, just a coat feature worth knowing about.
Full RSPO2 gene page →FGF5 sits at 58% for the long-coat variant. Coat length is influenced by other loci as well, so intermediate FGF5 frequencies do not always correspond to intermediate visible coat lengths.
FGF5what this gene does
FGF5 is a gene that influences the length of a dog's coat. It acts like a natural switch, telling hair follicles when to stop growing longer fur.
For your dog: If your dog has a notably long or short coat, FGF5 is likely part of the reason—no action needed, but it’s a neat genetic detail to know.
Full FGF5 gene page →KRT71 is near-fixed at 88% for the wavy/curly variant. Coat curl phenotype varies across breeds at this fixation depending on modifier loci, and visible expression is not always curled even when the locus is fixed.
KRT71what this gene does
KRT71 is a gene that influences the curliness of a dog's coat. It helps determine whether a dog's fur is straight or has a distinctive curl.
For your dog: If your dog has a curly coat, KRT71 is likely part of the reason; it’s a natural variation, not a health concern.
Full KRT71 gene page →MC1R sits at 56% at the representative SNP. MC1R controls the switch between red-to-gold pigment and black-to-brown pigment, with the e/e homozygous genotype producing the gold-to-red spectrum. Substrate frequencies at this SNP depend on the array's polarity, so visible coat color in the breed is a more reliable indicator than this single number.
MC1Rwhat this gene does
MC1R is a gene that influences coat color in dogs, affecting how pigments are produced in the fur.
For your dog: Knowing about MC1R gives insight into your dog's coat color but doesn't relate to health issues.
Full MC1R gene page →Ears
MSRB3 is at 96% for the drop-ear allele, the genetic basis of the breed's signature dropped ear set.
MSRB3what this gene does
MSRB3 is a gene involved in the development of ear shape and structure in dogs.
For your dog: Understanding MSRB3 helps explain why your dog's ears look the way they do, but it isn't linked to any health issues.
Full MSRB3 gene page →Skull shape
BMP3 sits at 55%, contributing to the breed's moderate, mesaticephalic head shape rather than the extreme brachycephalic form.
BMP3what this gene does
BMP3 is a gene that influences the shape of a dog's skull, particularly contributing to a shorter, broader head shape known as brachycephaly.
For your dog: If your dog has a broad, short skull, it's worth discussing with your vet how this might impact their health, even though BMP3 isn't directly tied to illness.
Full BMP3 gene page →SMOC2 is at 100%, the major locus contributing to the breed's brachycephalic face shape.
SMOC2what this gene does
SMOC2 influences the shape of a dog's skull, particularly affecting how flat or short the face appears.
For your dog: If your dog has a short nose, it's worth discussing with your vet how this trait might impact their health over time.
Full SMOC2 gene page →What genetic diseases do Scottish Terriers carry?
From a panel of 250 Mendelian-disease variants screened in 1,054,293 dogs (Donner et al. 2023), Scottish Terriers carry 4 of them at observable frequency. Carrier frequency is not clinical risk. Most recessive variants require two copies for disease expression; many dominant variants show incomplete penetrance. Read this as a population fingerprint of what's in the gene pool, not a per-dog prediction.
SLC37A2what this gene does
SLC37A2 is a gene involved in how cells manage certain sugar molecules, which can affect bone development.
For your dog: If your dog is from a breed known to carry this gene variant, it's worth discussing with your vet, especially if you notice jaw discomfort or eating issues.
ADAMTS17what this gene does
ADAMTS17 is a gene that influences body size and also plays a role in certain eye conditions. It affects the structure of tissues in the eye and elsewhere in the body.
For your dog: If your dog belongs to a breed known to carry ADAMTS17 variants, it’s worth discussing genetic testing and eye exams with your vet to stay ahead of potential issues.
Full ADAMTS17 gene page →Scottish Terriers are a natural model for human disease
Because the same genes cause the same conditions across species, the inherited conditions documented in Scottish Terriers help researchers understand, and work toward treating, the human diseases they model. This is the dog advancing human medicine. The breed models the human disease; it does not have it, and this is not a prediction for your dog.
- Alexander disease, modeled by the breed's Alexander disease, the same underlying biology.
- Ehlers-Danlos syndrome, classic type, 1, modeled by the breed's classical Ehlers-Danlos syndrome (cEDS), COL5A1-related, the same underlying biology.
- OMIM:114000, modeled by the breed's Craniomandibular osteopathy, generic, the same underlying biology.
- OMIM:619136, modeled by the breed's Craniomandibular osteopathy, SLC37A2-related, the same underlying biology.
- hemophilia B, modeled by the breed's Haemophilia B, the same underlying biology.
- OMIM:217090, modeled by the breed's Ligneous membranitis, the same underlying biology.
Every condition recorded in the Scottish Terrier
Beyond the testable carriers above, OMIA's literature catalogue records 11 genetic conditions in the Scottish Terrier, 9 of which have a known human equivalent. This is the documented landscape across all Scottish Terriers ever studied, not a prediction for any one dog.
- Alexander disease Autosomal dominantHuman equivalent: Alexander disease
- classical Ehlers-Danlos syndrome (cEDS), COL5A1-related Autosomal dominantHuman equivalent: Ehlers-Danlos syndrome, classic type, 1
- Craniomandibular osteopathy, generic MultifactorialHuman equivalent: OMIM:114000
- Craniomandibular osteopathy, SLC37A2-related Autosomal dominant with incomplete penetranceHuman equivalent: OMIM:619136
- Haemophilia B X-linked recessiveHuman equivalent: hemophilia B
- Ligneous membranitis Autosomal recessiveHuman equivalent: OMIM:217090
- Transitional cell carcinoma Somatic mutationHuman equivalent: OMIM:109800
- Urolithiasis Autosomal recessiveHuman equivalent: OMIM:220150
- Von Willebrand disease III AutosomalHuman equivalent: OMIM:277480
Where every number on this page came from.
This page draws on three primary data sources. Carrier frequencies for the Mendelian section come from Donner et al. 2023 (CC-BY-4.0). We grade these data at evidence Limited because the cohort is a direct-to-consumer ascertainment, which biases toward owners who chose to test their dogs. The panel also uses tag-SNP proxies for some variants rather than direct causal-variant assays. Limited is a study-design grade, not a quality grade: the Donner cohort is the largest open canine-genotype dataset in existence and we are grateful for it. We rate the confounding MEDIUM.
Population-genetic dimensions (heterozygosity, intra-breed PCA distance, nearest neighbors, trait-locus frequencies) come from CanVAS (Brundage 2026), harmonized through the Sniff Atlas. The exact release date and verification commit are pinned at the bottom of the page so a researcher can trace a number back to a specific snapshot. The disease-gene-variant graph comes from OMIA (Online Mendelian Inheritance in Animals; Nicholas, Tammen, and the Sydney Informatics Hub at the Sydney School of Veterinary Science, The University of Sydney; retrieved April 2026, DOI 10.25910/2AMR-PV70).
What this page does not yet have. Inheritance modes and per-disease penetrance evidence from Donner 2023 are now in the structured data for every variant the panel covers. Mondo, OMIM, Ensembl, and HGNC cross-references on gene pages remain pending, they arrive in December 2026 alongside the imputed 9.67M-variant CanVAS dataset via the OMIA SQL dump absorption. Until then, gene IDs carry NCBI Gene and OMIA phene URLs only; the wider human-homolog and disease-ontology cross-reference set fills in with that release.
How to cite this page. The computed dimensions on this page are derived from the open Sniff Atlas v1.0.1 (Gehring 2026, doi:10.5281/zenodo.20566358, CC-BY 4.0). Full citation formats including BibTeX, RIS, and CITATION.cff at sniff.world/cite.
We have 33 scottish terriers. We do not have yours.
Every scottish terrier added sharpens the breed's genetic neighborhood. Enrollment is free. The data stays open. The star is permanent.
- Donner J, Freyer J, Davison S, Anderson H, Blades M, Honkanen L, et al. (2023). Genetic prevalence and clinical relevance of canine Mendelian disease variants in over one million dogs. PLOS Genetics 19(2):e1010651. doi:10.1371/journal.pgen.1010651
- Brundage J, et al. (2026). CanVAS: a harmonized canine variant atlas. bioRxiv. doi:10.64898/2026.04.13.718238
- Nicholas, F.W., Tammen, I., & Sydney Informatics Hub. (2026). Online Mendelian Inheritance in Animals (OMIA) [dataset]. The University of Sydney. https://omia.org. doi:10.25910/2AMR-PV70 (retrieved April 2026).