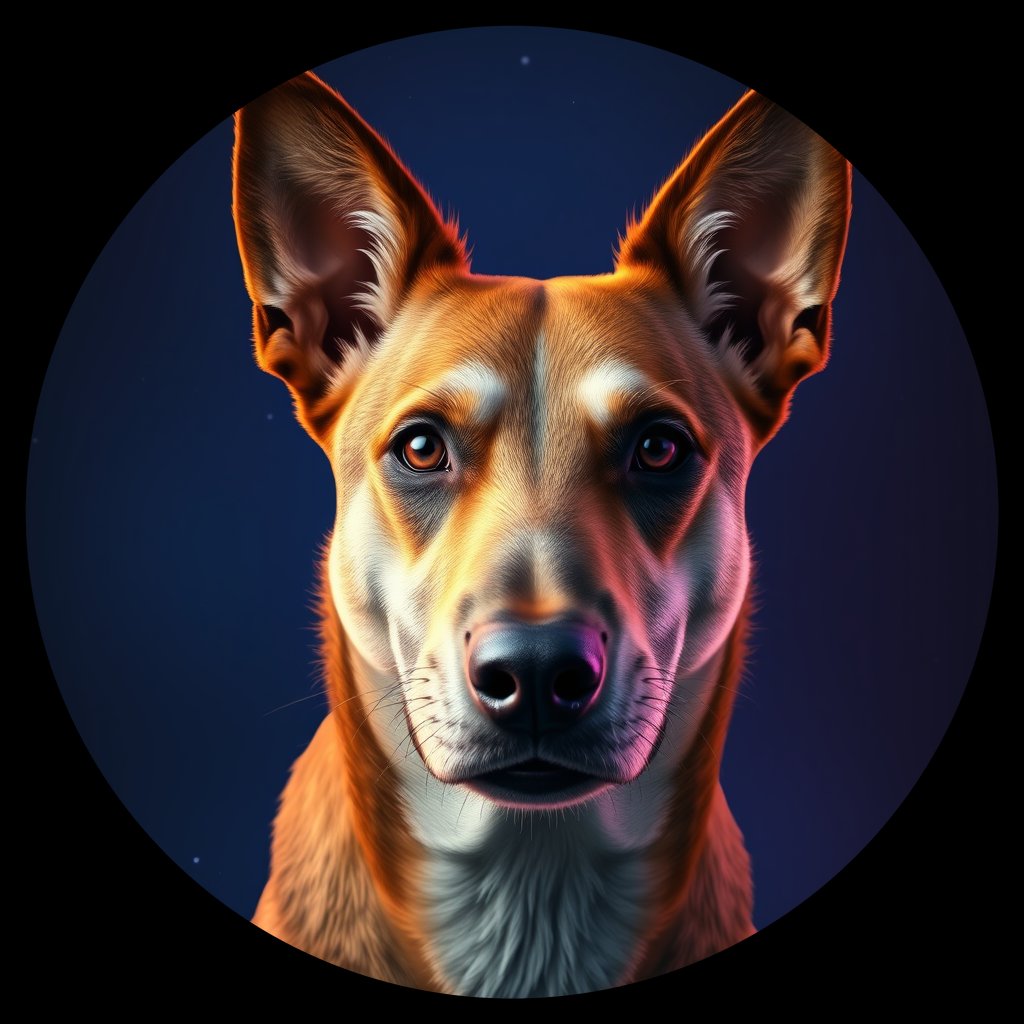
AI portrait
This portrait was algorithmically built from this dog's genome: their genotype at 8 morphology loci (coat length, curl, color, ear set, body size, head shape, skull, furnishings) plus their position within the 14,478-dog atlas. The same dog always reproduces the same portrait. A different dog with different alleles gets a different portrait.
AUCD_AUCD_19A10
AUCD_AUCD_19A10 is a Australian Cattle Dog from the Spatola research cohort. One of 14,478 dogs who built the atlas.
See AUCD_AUCD_19A10 in the atlasAUCD_AUCD_19A10 is a strong genetic outlier within the Australian Cattle Dog cluster - among the most distinctive examples of their breed.
- Predicted large by the six body-size genes the atlas reads (IGF1, HMGA2, SMAD2, LCORL, STC2, ADAMTS17).
- Standard leg length. No chondrodysplasia retrogene variant.
- Wire-coat furnishings - the eyebrow + beard variant at RSPO2.
The five dogs in the atlas whose genomes sit closest to AUCD_AUCD_19A10's. Click any of them to keep exploring.
AUCD_AUCD_19A10 sits in the Labrador Retriever cluster, with genome overlap to Golden Retriever - sister breeds nearby in the atlas.
Breed similarity from non-negative least squares against 91 breed centroids in PCA-256 space, corrected for atlas sample-size imbalance. Without correction, Goldens (22% of the atlas) leak into every dog's raw NNLS breakdown; with it, the bias falls out. Raw fractions stay in the dataset for re-derivation. Methodology.
- Labrador Retriever 59%
- Golden Retriever 42%
From the CanVAS (Spatola cohort) . Breed-page reference: Australian Cattle Dog.
Full genotype detail click to expand
The actual allele call at each locus's representative SNP for this dog. Each gene name links to its page where you can see the per-breed frequency table and the direction of effect.
Technical details click to expand
The numbers behind the placement. Useful for researchers reproducing the math or debugging an unexpected position; not interesting to most readers.
y 4.748
z 3.614
The 3 PCs on which AUCD_AUCD_19A10 scores most extreme, with the 3 highest-loading SNPs on each. Foundation for the future genome-ring visualization.
- chr6:30,830,915 loading 0.0329
- chr1:22,842,587 loading 0.0316
- chr7:61,438,680 loading -0.0291
- chr7:43,046,169 loading 0.0391
- chr13:1,840,654 loading 0.0338
- chr22:3,486,881 loading -0.0327
- chr25:40,121,397 loading 0.0326
- chr28:17,013,099 loading 0.0310
- chr26:15,170,564 loading 0.0302